JavaScript Charts & Graphs Source Code for Web and Desktop Developers.
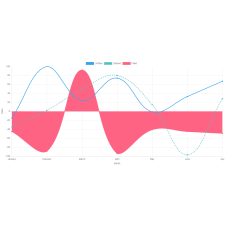
JavaScript Charts & Graphs with 10x better performance and a simple API. Integrates easily with popular JS Frameworks like AngularJS, etc. Library comes with 30 different types of charts including line, column, bar, area, spline, pie, doughnut, stacked charts, etc. It supports various interactive features like tooltips, zooming, panning, animation, events, drilldown, exporting and can easily be integrated with various server side technologies like PHP, Ruby, Python, ASP.Net, Node.JS, Java, etc. To top it all off, it can easily render thousands of data-points without any performance lag.
JavaScript Charts Library is a charting library written in pure JavaScript, offering an easy way of adding interactive charts to your web site or web application. JavaScript Charts Library currently supports line, spline, area, areaspline, column, bar, pie, scatter, angular gauges, arearange, areasplinerange, columnrange, bubble, box plot, error bars, funnel, waterfall and polar chart types.
Simple yet flexible JavaScript charting for designers & developers. Simple, clean and engaging HTML5 based JavaScript charts. JavaScript Charts is an easy way to include animated, interactive graphs on your website.
JavaScript Charts makes it easy for developers to set up interactive charts in their web pages.
JavaScript Charts lets you create stock or general timeline charts in pure JavaScript. Including sophisticated navigation options like a small navigator series, preset date ranges, date picker, scrolling and panning.
JavaScript Charts with drill down and touch support. Build interactive maps to display sales, election results or any other information linked to geography. Perfect for standalone use or in dashboards in combination with JavaScript Charts!
JavaScript Charts Library features:
- Lightweight and fast. The library contains a set of 6 charts and is 11Kb gzipped, this makes its loading time and page impact low.
- Responsive charts. The charts are fully responsive, meaning they resize based on the viewport width.
- Clear documentation. The documentation is well organized and provides detailed information on using each feature.
- Supports multiple X and Y axes. Multiple Y axes are important for trend correlation, eg. Comparing a number of clicks to sale amounts. Not same scales/units.
- Open source. Provide full source code for integration.
- Chart types. Visualize your data in 8 different ways; each of them animated and customizable.
- HTML5 Canvas. Great rendering performance across all modern browsers (IE11+).
- Responsive. Redraws charts on window resize for perfect scale granularity.
- HTML 5. Based on native browser technologies, no plugins needed
- Responsive & mobile ready. Intelligently adapts to any device and supports multi-touch gestures.
- Speed! Fastest development, implementation and rendering on the market.
Use Javascript Charts in a sample HTML file,
[!DOCTYPE html]
[html
lang="en"]
[head]
[meta
charset="UTF-8"]
[meta
name="viewport"
content="width=device-width,
initial-scale=1.0"]
[meta
http-equiv="X-UA-Compatible"
content="ie=edge"]
[title]Exploring
JS Chart Library[/title]
[/head]
[style]
.container
{
width:
50%;
height:
50%;
}
[/style]
[body]
[button
id="renderBtn"]
Render
[/button]
[div
class="container"]
[canvas
id="myChart"][/canvas]
[/div]
[/body]
[script
src="https://cdnjs.cloudflare.com/ajax/libs/Chart.js/2.7.2/Chart.js"][/script]
[script
src="https://code.jquery.com/jquery-3.3.1.min.js"][/script]
[script]
function
renderChart(data,
labels) {
var
ctx
=
document.getElementById("myChart").getContext('2d');
var
myChart
=
new
Chart(ctx,
{
type:
'line',
data:
{
labels:
labels,
datasets:
[{
label:
'This week',
data:
data,
}]
},
});
}
$("#renderBtn").click(
function
() {
data
=
[20000,
14000,
12000,
15000,
18000,
19000,
22000];
labels
=
["sunday",
"monday",
"tuesday",
"wednesday",
"thursday",
"friday",
"saturday"];
renderChart(data,
labels);
}
);
[/script]
[/html]
JavaScript Charts & Graphs Source Code
- Product Code: MOD190301175428
- Availability: In Stock
- Viewed: 13596
- Sold By: PhotoStudio
- Seller Reviews: (0)
-
$49.95
Available Options
Related Products
PDF Signer Software
PDF Signer can be used to add your signature to PDF documents. The main function of PDF Signer is ..
$39.95
EMF to Vector Converter Command Line
EMF to Vector Converter Command Line Software can be used to convert from EMF and WMF Metafile file..
$295.00
PDF Viewer for WordPress & JavaScript
PDF Viewer Plugin for WordPress & JavaScript PDF Viewer Plugin for WordPress & JavaScript is a resp..
$39.00
Javascript Image Slider
Javascript Image Slider - Non jQuery Javascript Image Slider Highlight Features: Hardware..
$29.95
DWG to SVG Converter Command Line
AutoCAD DWG, DXF to SVG Converter Command Line allows you convert DWG and DXF files to PDF and SVG..
$199.00
PDF to SVG Converter Command Line
PDF to SVG Converter Command Line VeryUtils PDF2SVG is a multi-platform command-line application fo..
$295.00
Photo Watermark Command Line
Photo Watermark Command Line is a very powerful tool for manipulating and combining images. You ca..
$19.95
PowerPoint to Video Converter Command Line
PowerPoint to Video Converter Command Line turns PowerPoint files into videos.Take your Microsoft ..
$79.95
HTML5 PDF Annotator Source Code License
HTML5 PDF Annotation Source Code License HTML5 PDF Annotation is a HTML5 Based Document & Image Ann..
$6,500.00
docuPrinter GUI, Command Line and SDK
docuPrinter SDK is a Virtual PDF/PS/Image Printer Driver -- Convert, Email, Print or Combine docum..
$79.00
TIFF Toolkit -- Compress, Merge, Split, Extract, Compare and Maintain TIFF files
TIFF Toolkit is a powerful application tool which can compress TIFF image files to small size ones..
$19.95
Easy Barcode Generator
Easy Barcode Generator is a suite of programs to allow easy encoding of data in any of the wide ra..
$39.95
jsPlayer -- HTML5 Video Player with Playlist & Multiple Skins
jsPlayer is a powerful responsive JavaScript and jQuery based video player that can play various a..
$59.95
PDF to Excel Converter Command Line
PDF to Excel Converter Command Line is a command line application to extract tables from PDF files..
$299.00
Tags: chart library, html5 charts, javascript chart, javascript charting, javascript charts, js charts

