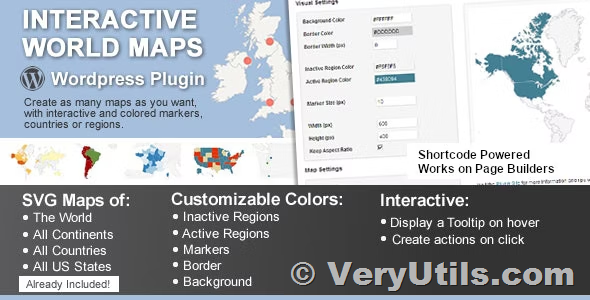
In today's competitive landscape, businesses across diverse sectors rely heavily on data visualization to drive decisions and enhance operational efficiency. VeryUtils Interactive SVG Map Component offers a robust solution tailored to meet the demand for interactive and customizable mapping solutions, empowering organizations to highlight Key Performance Indicators (KPIs) and delve deeper into geographical insights.
https://veryutils.com/interactive-svg-map
Overview
The VeryUtils Interactive SVG Map Component revolutionizes how businesses visualize and interact with geographical data. By integrating Scalable Vector Graphics (SVG), this component enables seamless customization of maps, catering to industries such as retail, public administration, logistics, and office space management. Whether analyzing store performance, managing geographic territories, optimizing warehouse operations, or designing office layouts, VeryUtils provides the tools to transform static maps into dynamic, interactive assets.
Key Features & Functionality
- Custom SVG Map Integration:
- Businesses can upload their own SVG map images, allowing for precise visualization of specific regions or locations pertinent to their operations.
- Advanced Area Customization:
- Define areas on the map and apply different colors or hex codes based on predefined parameters (e.g., KPI metrics). Customize tooltips to display relevant information and choose interactive effects for mouse hover interactions. Optionally, configure click events for detailed area exploration.
- Interactive Navigation:
- Users can zoom in and out of the map using intuitive controls such as mouse gestures, buttons, or icons, facilitating detailed exploration and analysis.
- Pan and Navigate:
- Pan across the map within the component's viewport area, ensuring seamless navigation and focus on specific geographic details.
- Document Generation:
- Utilize templates to populate text fields within the map image with data values extracted from VeryUtils Interactive SVG Map Component. This feature streamlines report generation and enhances data presentation capabilities.
- Area Selection and Indexing:
- Upon selecting an area, the component returns the index of the chosen region, facilitating access to detailed data associated with that area. This functionality enhances decision-making by providing contextual insights based on geographical analysis.
- Rich Text Editor Integration:
- Leverage the Rich Text Editor's image upload system to convert interactive maps into PNG image documents. This capability is invaluable for creating detailed reports or providing visual data summaries for stakeholders.
Use Cases
- Retail: Visualize store performance metrics across different regions or store types to optimize sales strategies.
- Public Sector: Manage and analyze geographic data for efficient resource allocation and service delivery.
- Logistics: Optimize warehouse operations by visualizing inventory distribution and logistics planning.
- Office Space Design: Design and allocate office spaces based on organizational needs and spatial efficiency.
VeryUtils Custom-built Development Service
In addition to the Interactive SVG Map Component, VeryUtils offers custom-built development services tailored to specific business requirements. Whether integrating additional functionalities, adapting the component to unique use cases, or developing entirely new solutions, VeryUtils ensures that organizations receive personalized support to maximize the value of their interactive mapping applications.
Conclusion
VeryUtils Interactive SVG Map Component represents a paradigm shift in how businesses harness geographical data for strategic advantage. By combining flexibility, functionality, and intuitive design, VeryUtils empowers organizations to transform complex data into actionable insights. Explore the limitless possibilities of interactive mapping with VeryUtils and redefine how you visualize and interact with geographical data.
To learn more about VeryUtils Interactive SVG Map Component and our custom-built development services, visit https://veryutils.com/interactive-svg-map. Take your data visualization to new heights with VeryUtils today.
